.png&w=96&q=75)

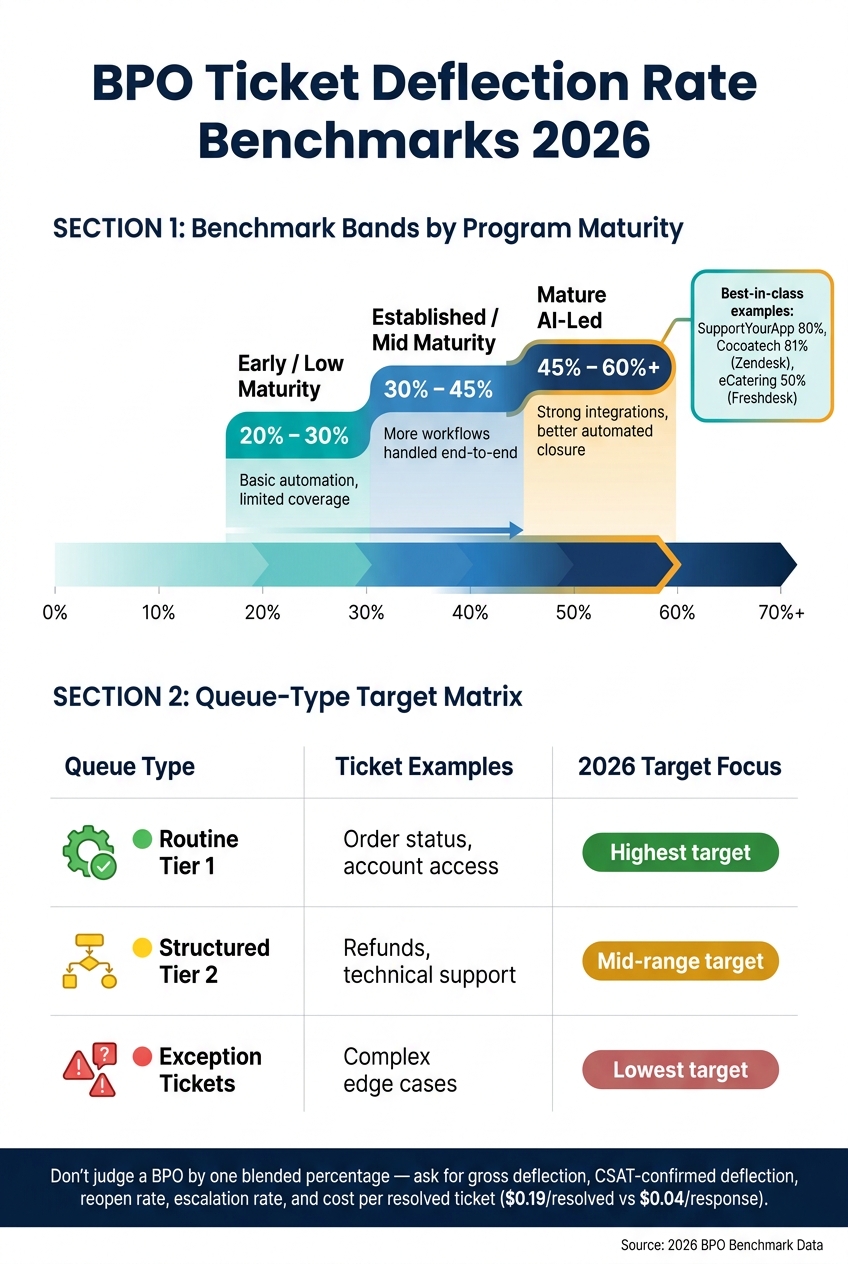
If you want the short answer: a “good” BPO ticket deflection rate in 2026 is usually 20% to 30% for early programs, 30% to 45% for established programs, and 45% to 60%+ for mature AI-led setups.
That said, one top-line number can mislead you. I’d only trust a benchmark after I see how the team defines deflection, which ticket types are included, which channels are in scope, and whether the issue was closed without any agent handoff.
Here’s the article in plain English:
- Deflection means the ticket was fully solved with no human agent involved
- Containment is not the same thing; it only shows the case stayed inside automation
- High numbers can look better than they are if reopen rates, escalations, or weak labeling are hidden
- Best-in-class ranges usually come from AI-led systems with strong integrations and knowledge graphs
- Queue-level targets beat one blended target, because password resets, refunds, and hard support cases do not behave the same way
A few numbers matter more than the headline claim:
- Gross deflection rate
- CSAT-confirmed deflection
- Reopen rate
- Post-deflection escalation rate
- Cost per resolved ticket, such as $0.19 per resolved ticket versus $0.04 per response
Here’s a quick view of the benchmark bands:
| Program stage | Typical 2026 deflection rate | What it usually means |
|---|---|---|
| Early | 20% to 30% | Basic automation, limited coverage |
| Established | 30% to 45% | More workflows handled end-to-end |
| Mature AI-led | 45% to 60%+ | Strong integrations, better automated closure |
The main point is simple: don’t judge a BPO by one blended percentage. I’d look at ticket mix, channel split, queue type, and proof that the system solved the issue, not just kept the customer inside a bot flow.
What does ticket deflection rate mean in a BPO setting
In a BPO, a deflected ticket gets solved without any agent handoff. That can happen through self-service, a chatbot, or an AI agent that finishes the job on its own.
Here’s the key distinction: containment measures how long a case stays inside automation, while deflection measures whether the ticket actually closed without human help. And first contact resolution applies to human-handled tickets supported by AI assistants that get solved on the first reply, so it’s a different KPI.
The formula and what counts as a deflected ticket
The formula is simple: divide the number of tickets closed without agent handoff by the total number of tickets received, then multiply by 100.
A ticket counts as deflected only when the customer’s issue is fully resolved, and no agent touches the case at any point.
AI deflection vs. resolution, containment, and first contact resolution
These terms often get lumped together in BPO reporting, but they’re not the same.
Deflection is the clearest signal: Did the ticket close without a human?
Resolution rate tells you how many of those deflected tickets actually fixed the customer’s problem.
Containment rate is broader. It counts any ticket that stayed inside the automated channel, even if the customer left unsatisfied.
With that definition in place, the next step is to compare benchmark bands by program maturity and ticket type.
sbb-itb-97114f1
2026 ticket deflection rate benchmarks for BPOs
BPO Ticket Deflection Rate Benchmarks 2026: By Program Maturity & Queue Type
Benchmarks by program maturity
A BPO's deflection benchmark only means anything when source coverage, QA review, and handoff rules are clearly defined. If those pieces are fuzzy, the number can look better than the operation actually is.
Higher deflection comes from one thing: the system has to resolve tickets automatically, not just send them somewhere else. That's the part people often blur. A workflow that routes tickets away from agents may look efficient on paper, but that isn't deflection if the issue still needs human help.
Low ticket classification accuracy can also skew the picture. If the wrong tickets get counted as closed, deflection rates rise on paper even when performance hasn't improved. That's why it helps to separate benchmark ranges from reporting quality before treating any figure as fact.
Why blended averages hide the real story
Blended averages smooth everything out, and that's exactly the problem. The same benchmark range can mean very different things once you break results out by system and ticket type.
Deflection only counts when a ticket closes without an agent handoff. In practice, that definition gets bent in reporting more often than many BPOs would like to admit. A high rate doesn't say much on its own unless you can see how each ticket was classified and why it was marked as resolved.
For 2026, benchmark reporting needs per-system tables that show performance at a granular level: per channel, per ticket type, and per workflow. Without that split, you're looking at a blended number that can hide weak spots, messy routing, or bad labeling.
Ask for a ticket-level label for every deflection, split between source data and AI reasoning.
How to evaluate a BPO ticket deflection benchmark without getting misled
Benchmarks can look clean on the surface and still hide a lot underneath. If you want to judge a BPO ticket deflection number fairly, you need to look past the headline and ask what’s holding it up.
5 numbers to ask for before you accept a benchmark
Before you accept any BPO ticket deflection benchmark, ask for five numbers under the top-line claim.
- Gross deflection rate: tickets closed without agent touch, divided by total tickets. This is the starting point.
- CSAT-confirmed deflection: gross deflection filtered to tickets where the customer confirmed the issue was resolved. A closed ticket with a poor rating should not count as a valid resolution.
- Reopen rate: how often a resolved ticket comes back. A high reopen rate usually means the fix was too shallow.
- Escalation rate post-deflection: how many tickets the system tried to resolve before handing off anyway. High escalation pushes the real deflection number down.
- Cost per resolved ticket: response-based pricing can hide spend. At $0.19 per resolved ticket, the math is simple; at $0.04 per response with multiple exchanges, the cost adds up before the ticket closes.
These checks make side-by-side comparisons much cleaner. Without them, one BPO program can look stronger than another when it’s just using looser math.
What most people get wrong about high deflection claims
A lot of teams treat high containment like deflection. That’s where things go sideways. Containment just means the system kept the user inside the flow. It does not always mean the issue got solved.
Another common miss is cherry-picking ticket categories. A system that handles mostly password resets and billing FAQs can post strong numbers. But once you add harder cases, the picture changes. Tickets that need order lookups, policy exceptions, or multi-step reasoning still end up with agents.
There’s also the question of whether the system can show the facts it used and the reasoning it followed. That matters more than people think. Basic self-service tools search for keywords. True autonomous resolution traces connections between concepts to form a solution. If a BPO’s system can’t explain why it resolved a ticket, it’s probably a containment tool, not a resolution engine.
Real examples that put the ranges in context
The gap between a 50% and an 80% deflection rate usually comes down to two things: ticket mix and the way the system defines resolution.
SupportYourApp, a BPO, reached 80% resolution and saved roughly $14,000 per month.
eCatering landed at 50% autonomous resolution through Freshdesk.
Those numbers show why the same benchmark band can mean very different things. On paper, the results may look close. In practice, the ticket types and resolution rules can change the story quite a bit.
Key takeaways and how to set your own 2026 target
Start with these benchmark bands for 2026:
- 20% to 30% for low-maturity programs
- 30% to 45% for mid-maturity programs
- 45% to 60%+ for mature AI-led programs
Treat those ranges as a starting point, not a one-size-fits-all goal. The better move is to set targets by queue type.
One target for every queue usually falls apart fast. An order status queue is nothing like a refund queue, and neither behaves like a technical support queue. If you lump them together, the number may look neat on a slide, but it won't help much with planning.
A simple benchmark matrix for SaaS and e-commerce teams
Here’s the simplest way to set those targets.
| Queue type | Ticket examples | 2026 target focus |
|---|---|---|
| Routine tier 1 | Order status, account access | Set the highest target |
| Structured tier 2 | Refunds, technical support | Set a mid-range target |
| Exception tickets | Complex edge cases | Set the lowest target |
After that, tie each queue target to staffing and monthly cost. That way, your queue targets don’t just sit in a spreadsheet - they shape headcount plans and budget decisions. To improve these metrics without increasing headcount, teams often use AI-generated reply suggestions to handle routine queries faster.
.png)


.png&w=828&q=100)
.png&w=96&q=100)
.png&w=828&q=100)
.png&w=96&q=100)