1
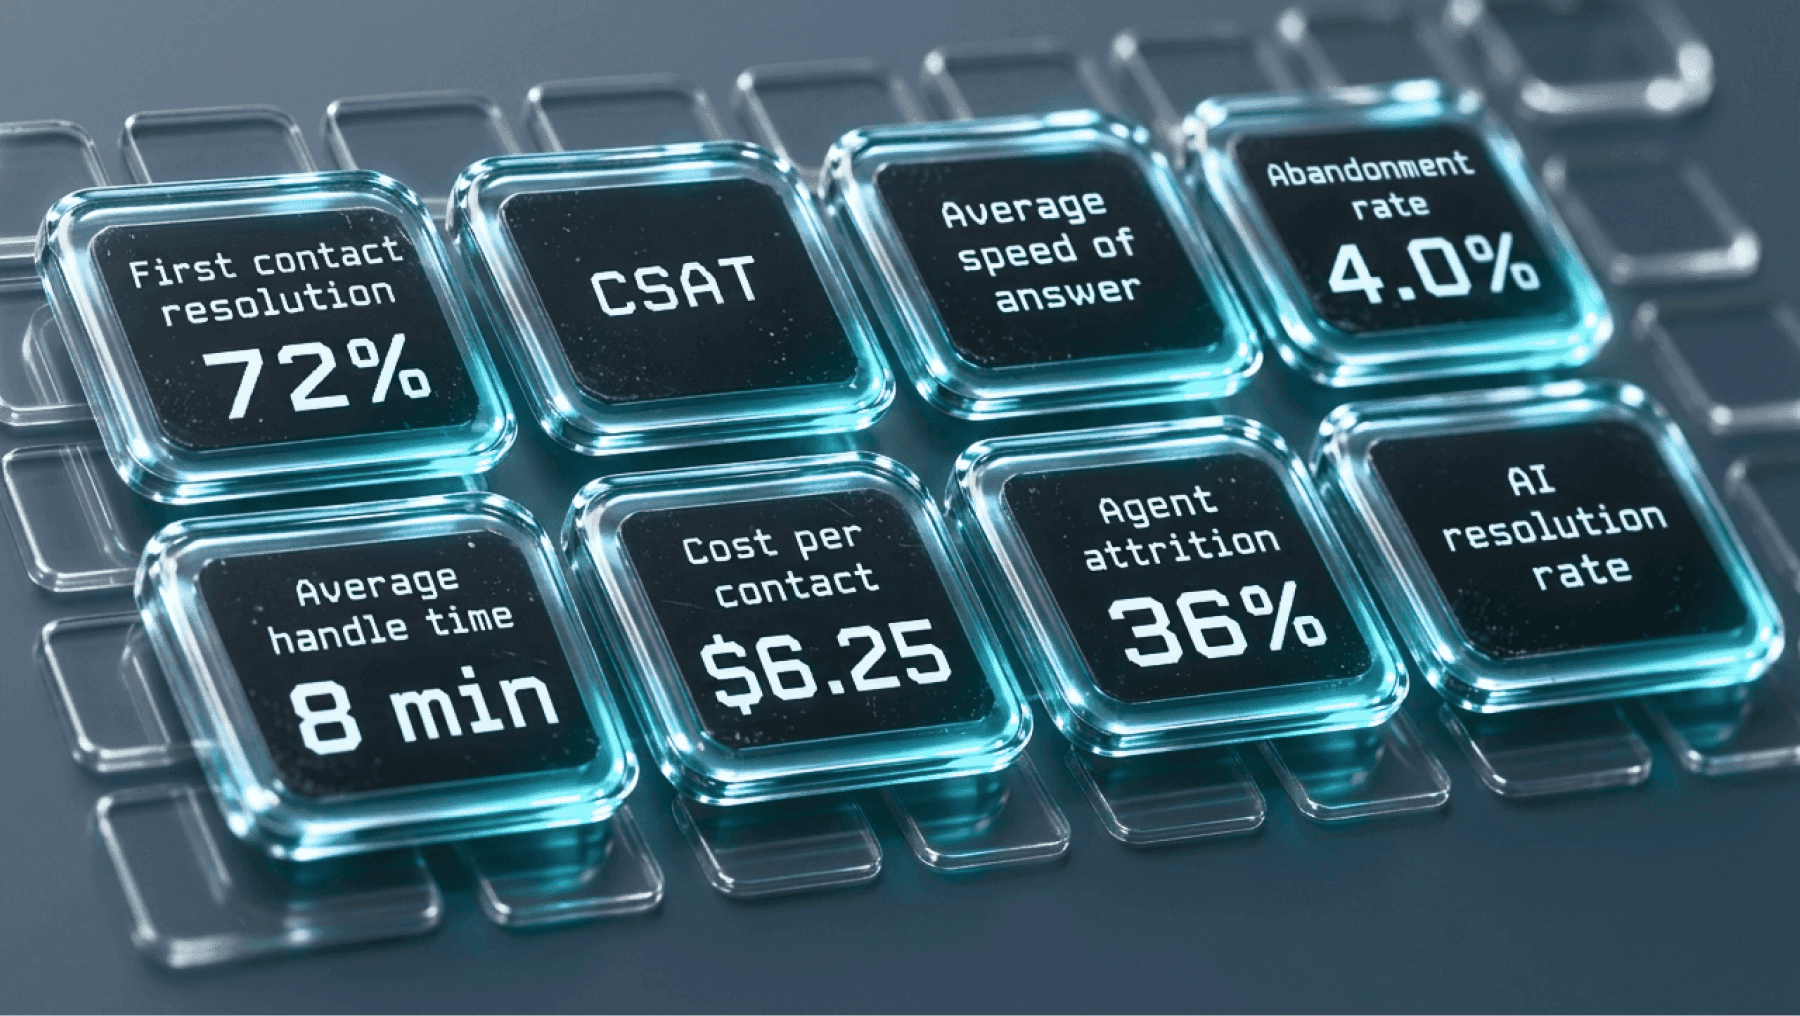
Monday, 8:40. The CSAT line slants up four points, the best week of the quarter. The same week, 800 callers hung up before anyone said hello. Both facts sit on one screen. Call center metrics are the numbers that tell you how fast customers get an answer, whether the problem gets solved, what each contact costs and how well the team holds up. Reading them together is the job.
Most dashboards show thirty of them. Eight earn the wall, and this article defends each one with its formula, its blind spot and the metric that covers for it. The other metrics get a reference table with formulas and sourced benchmarks, so nothing you track today goes missing.
At the budget review the CFO asks one question about the queue. With thirty tiles on the screen, you spend the first three minutes choosing which tile answers it. A long dashboard is an alibi. Whatever story you need to tell, one tile backs it up, and everyone in the room knows it.
The list is built for a queue of 10 to 100 agents at an e-commerce or SaaS company. Seven of the eight work on any queue. The eighth exists once an AI agent answers first.
Four tests for a place on the wall
Each of the eight passed four tests.
- One formula, one denominator. If two analysts compute it two ways, the tile shows an opinion.
- A lever. Someone on the floor can move it next week by doing something specific.
- An audience outside the queue. A CFO, a product lead or a customer cares what it means.
- No twin. When two metrics move together almost every time, keep the one that's harder to game.
What got cut, and where it lives now
Calls per hour fails the twin test, because it's mostly average handle time read backwards. Occupancy fails it too: handle time, volume and logged-in hours produce it by arithmetic, so it lives in the staffing model. Schedule adherence explains a miss in speed of answer. NPS and customer effort score ask the CSAT question from further away. Hold time and after-contact work sit inside handle time. Transfer rate and repeat contact rate show up in first contact resolution.
"Cut" means off the wall. Keep these in the drill-down, so that when a wall metric moves you can find out why. The table below holds all of them.
The full list: 17 call center performance metrics with formulas and benchmarks
Where a benchmark has a named source, the source is in the cell. Where the pages that rank for this topic quote a range without one, the cell says "no public benchmark", because a CFO asks where a number came from.
| Metric | On the wall | Formula | Benchmark | Trap |
|---|---|---|---|---|
| Service level | No (read beside speed of answer) | Contacts answered within the target time ÷ contacts offered × 100 | 80/20 is a convention with no measured benchmark behind it | Dividing by answered contacts hides everyone who gave up |
| Average speed of answer (ASA) | Yes | Total wait of answered contacts ÷ answered contacts | 89 seconds (MetricNet, IT service desks) | The average hides the longest waits; report them beside it |
| First response time | No | Sum of (first reply time − creation time) ÷ tickets replied to | No public benchmark | Auto-acknowledgements and AI replies count as instant; split them out |
| Abandonment rate | Yes | Abandoned contacts ÷ contacts offered × 100 | 5.8% (MetricNet, IT service desks) | Without a stated cutoff for very short abandons, two teams measure two things |
| First contact resolution (FCR) | Yes | Issues resolved at first contact ÷ total issues × 100 | Average 71%, good 70% to 79%, world class 80% or higher (SQM Group) | Survey-based and repeat-based versions disagree; label the one you use |
| Repeat contact rate | No (inside FCR) | Contacts repeating an issue inside your window ÷ total contacts × 100 | No public benchmark | The window sets the number; a short window and a long one are different metrics |
| Customer satisfaction (CSAT) | Yes | Ratings of 4 or 5 ÷ all ratings × 100 | No public benchmark | Response rates skew to the extremes; print the response count |
| Net promoter score (NPS) | No | % promoters − % detractors | No public benchmark | Measures the brand more than the call |
| Customer effort score (CES) | No | Average score on "how easy was it" | No public benchmark | Hard to compare across survey wordings |
| Average handle time (AHT) | Yes | (Talk + hold + after-contact work) ÷ contacts handled | No public benchmark | Dropping after-contact work flatters the number and slows the queue |
| Occupancy | No (staffing model) | Handle time ÷ logged-in time × 100 | No public benchmark | Occupancy that never dips leaves agents no recovery time |
| Schedule adherence | No | Time in adherence ÷ scheduled time × 100 | No public benchmark | Rewards sitting at the desk; read it beside service level |
| Shrinkage | No (staffing model) | (Paid hours − logged-in hours) ÷ paid hours × 100 | No public benchmark | A schedule built without it understaffs the floor |
| Agent attrition | Yes | Agents who left ÷ average headcount × 100 | 38% a year (Deloitte Digital); 43.1% for IT service desk analysts (MetricNet) | In a small team one leaver swings the month; use a rolling twelve months |
| Cost per contact | Yes | Total operating cost ÷ contacts handled | $7.80 at large B2C companies, up from $6.70 two years earlier (Deloitte Digital) | Wages only, or fully loaded? State which |
| AI resolution rate | Yes (AI-first queues) | AI conversations resolved ÷ all AI conversations started × 100 | No public benchmark (one customer case below) | "Resolved" needs a written rule; a silent customer may have given up |
| Escalation rate | No (read beside AI resolution rate) | Conversations handed to a person ÷ conversations the AI started × 100 | No public benchmark | A low rate can mean customers are stuck; pair it with repeat contact rate |
The pairing map
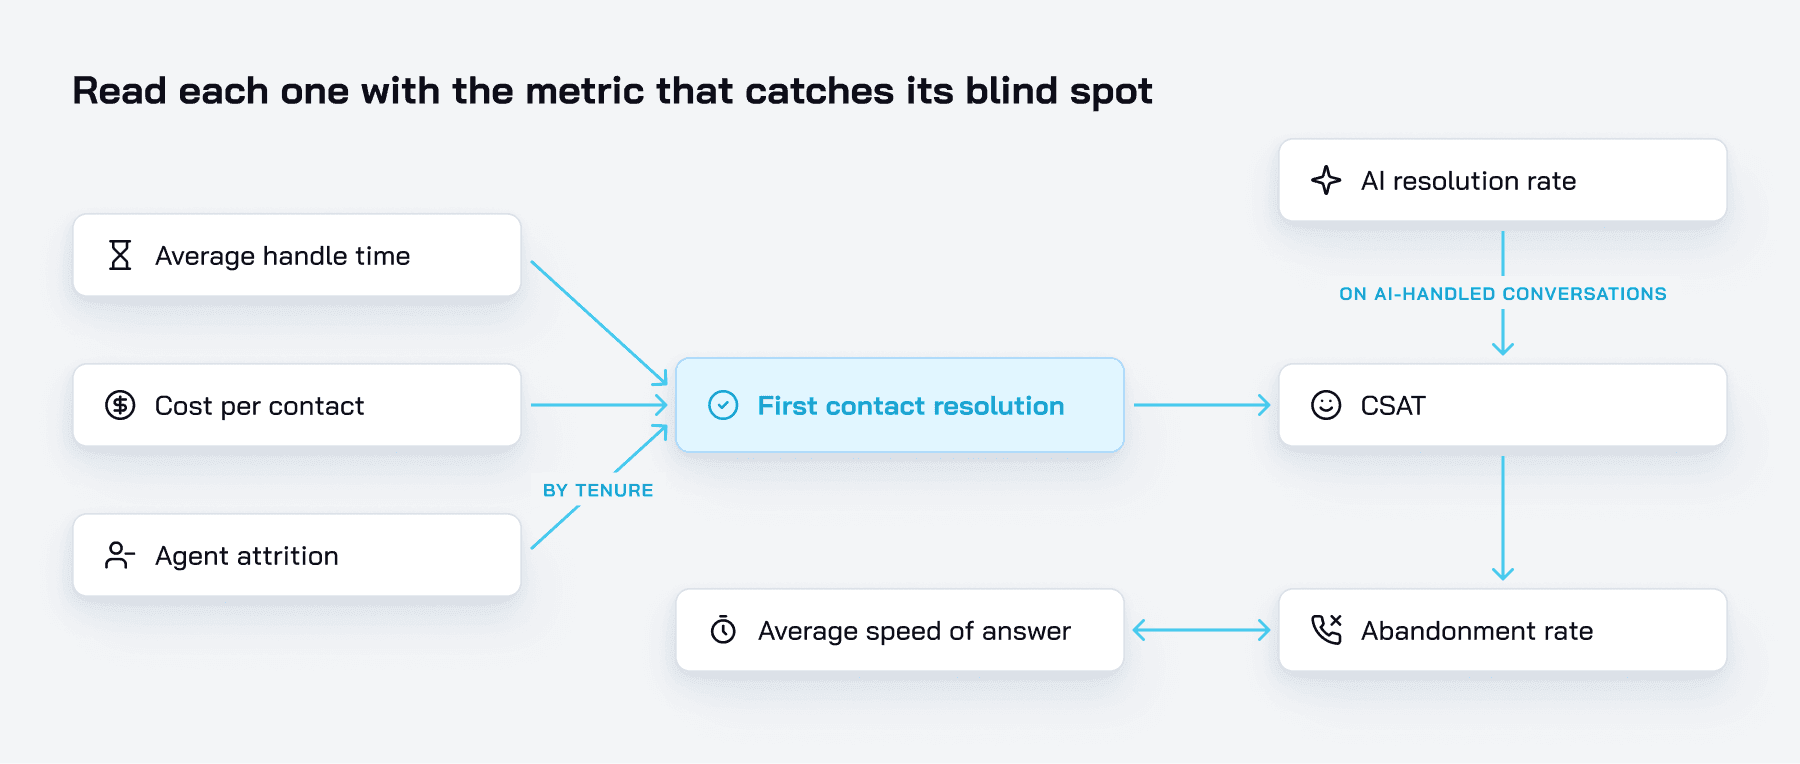
Each of the eight lies a little when it stands alone. The last column names the one that catches the lie.
| Metric | Formula | What it hides alone | Read it with |
|---|---|---|---|
| First contact resolution | Issues solved on first contact ÷ all issues × 100 | Customers who gave up count as solved | CSAT |
| CSAT | Ratings of 4 or 5 ÷ all ratings × 100 | Only customers who got through the queue answer | Abandonment rate |
| Average speed of answer | Total wait of answered contacts ÷ answered contacts | A few very long waits vanish in the average | Abandonment rate |
| Abandonment rate | Contacts abandoned ÷ contacts offered × 100 | Why they left, and where your cutoff sits | Average speed of answer |
| Average handle time | (Talk or chat + hold + after-contact work) ÷ contacts handled | Whether the problem got solved | First contact resolution |
| Cost per contact | Total operating cost ÷ contacts handled | Repeat contacts make the average look cheaper | First contact resolution |
| Agent attrition | Agents who left ÷ average headcount × 100 | Which agents left | First contact resolution by tenure |
| AI resolution rate | AI conversations resolved ÷ all AI conversations started × 100 | A narrow scope flatters the rate | CSAT on AI-handled conversations |
First contact resolution appears in the last column three times. That's why it comes first.
The examples below run on one made-up month: 25 agents with 136 logged-in hours each (3,400 hours), 20,000 contacts offered, 800 abandoned, 19,200 handled at 8 minutes each, 15,000 distinct issues, and $120,000 of total operating cost. The numbers are invented; the arithmetic checks out.
First contact resolution: the hub
Every repeat contact is a bill you pay twice.
Formula: issues solved on the first contact ÷ all issues × 100. Set the window once, for example 7 days without a return on the same issue, and keep it.
In the made-up month, 15,000 issues arrive and 4,200 need a second contact. That leaves 10,800 solved the first time: 72%.
SQM Group's post-call surveys at more than 500 North American call centers put the industry average at 71%. Good runs from 70% to 79%, and 80% or higher is world class. Only 5% of call centers reach 80%.
FCR moves three other numbers at once, which is the whole case for it. One point of FCR in the made-up month is 150 fewer repeat contacts: about $940 at $6.25 a contact, and 20 agent hours (150 × 8 minutes = 1,200 minutes).
What it can't see is the customer who gave up. A closed ticket and a solved problem differ, and a customer who walked away never shows up as a repeat. Watch the method too. SQM measures FCR by asking callers, so a number you calculate from repeat-contact tracking won't compare cleanly.
Put CSAT on the tile next to it. A ticket closed on first contact and rated 2 out of 5 is a repeat contact that hasn't happened yet.
Customer satisfaction: the survivors' vote
CSAT is a poll of the people who made it through.
Formula: ratings of 4 or 5 on a 5-point scale ÷ all ratings × 100.
In the made-up month, 2,400 customers answer the survey (12.5% of 19,200 contacts) and 1,920 give a 4 or 5: CSAT of 80%.
It earns its tile as the one number among the eight that comes from the customer's own answer rather than a timestamp or a count. The lever is on the floor too: what agents say in the last minute of a contact moves it week to week.
This article quotes no CSAT benchmark. No published range comes with a named method, and a baseline from last quarter tells you more than a range from someone else's queue. Report the change.
The blind spot is everyone who left the queue before the survey. A team can raise its CSAT by losing unhappy customers earlier, which is how the CSAT line in the opening scene went up in the week 800 callers hung up. Print the response count beside the score; 90% on 40 responses is a rumor.
The tile beside it is abandonment rate. When both climb in the same week, the score rose because the unhappy customers never got to vote.
Average speed of answer: watch the tail
Formula: total wait time of answered contacts ÷ answered contacts.
MetricNet's benchmark of internal IT service desks, a neighboring field because those desks serve employees, puts the average at 89 seconds. Use it as a reference point and label it that way.
Wait is the first thing a customer experiences, and the roster moves it directly. That's the lever test passed.
The average hides the tail. Take two queues with the same 90 seconds. In the first, every customer waits about 90 seconds. In the second, nine in ten wait 10 seconds and the tenth waits 810 seconds, 13.5 minutes: (9 × 10 + 810) ÷ 10 = 90. Same tile, different Mondays.
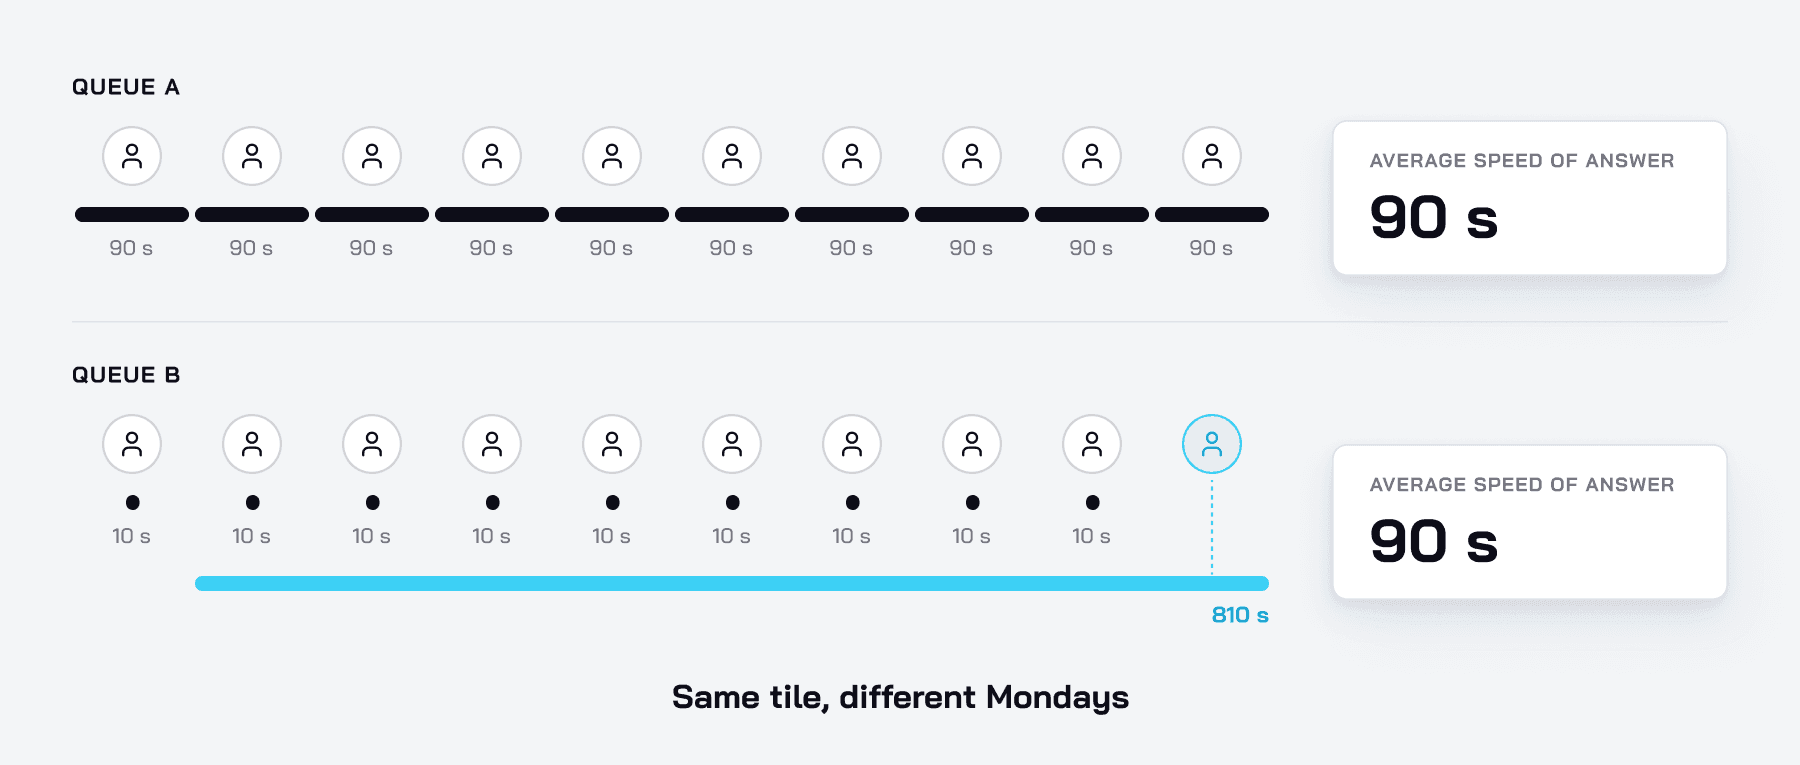
Report the share answered within a threshold beside the average. That's service level: contacts answered within X seconds ÷ contacts offered. The famous threshold is 80/20, meaning 80% of calls answered within 20 seconds. It's a convention call centers copy from each other, and no measured benchmark stands behind it. Pick a threshold per channel and publish it on the dashboard. And report the worst week beside the month: a month that passes the threshold can hold a week that missed it by twenty points, and the month average is where that week goes to hide.
Abandonment rate belongs next to it. The average says how long people waited; abandonment says how many stopped waiting.
Abandonment rate: the customers lost at the door
Abandonment counts the customers you lost before you met them.
Formula: contacts abandoned ÷ contacts offered × 100. Remove contacts that drop within the first few seconds, and write that cutoff down before the first report.
MetricNet's benchmark of IT service desks shows 5.8%. The made-up month: 800 ÷ 20,000 = 4.0%.
It's the only metric that counts demand you failed to serve. Every other tile describes customers you reached.
It says nothing about the reason. A caller who hangs up at second four hit the wrong number. A caller who hangs up at minute six is gone or about to call back, and the callback arrives as a new contact that flatters cost per contact. Chat needs its own rule: decide whether a visitor who closes the widget before typing counts.
Keep average speed of answer on the same row. When the average stays flat and abandonment climbs, the tail got longer or patience got shorter.
Average handle time: the dial
AHT is a dial on the staffing model. Put a target on each agent and it becomes a stopwatch.
Formula: (talk or chat time + hold time + after-contact work) ÷ contacts handled.
In the made-up month, 19,200 contacts × 8 minutes = 153,600 minutes, or 2,560 hours. That's 75% of the 3,400 logged-in hours. Hours needed equal volume times AHT, and that turns a forecast into a roster.
Alone, it hides whether the problem got solved. Agents under a handle-time target rush, FCR falls, and the minutes come back as repeat contacts.
Drafting help moves AHT without the rush. CoSupport AI Assistant drafts replies and summarizes threads for agents, which shortens the writing and the reading while the agent keeps the decision.
When an AI agent takes the routine contacts, AHT on the human queue rises, because what's left is harder. Read the rise as a change in mix. The AHT and AI impact article walks through it. This article quotes no AHT benchmark: issue mix and channel move it so far that a single range misleads.
Put first contact resolution on the tile next to it, and a falling AHT stops looking like a win until FCR holds.
Cost per contact: the number the CFO already has
The CFO has this number already. Bring yours with its denominator explained.
Formula: total operating cost (people, tools, overhead) ÷ contacts handled.
Deloitte Digital's 2026 Global Contact Center Survey puts the cost per assisted contact at large B2C companies at $7.80 on average, up from $6.70 two years earlier. The made-up month: $120,000 ÷ 19,200 = $6.25.
It's the only dollar figure on the wall, and it's the language of whoever approves headcount.
The denominator is where it cheats. Divide by contacts offered instead of handled and $6.25 becomes $6.00, a saving made entirely of abandoned callers. With a fixed roster, every repeat contact lowers the average too. Divide by issues instead of contacts and the same month reads $120,000 ÷ 15,000 = $8.00. A $6.25 contact is an $8.00 issue.
Averages blur ticket types as well. The cost-to-serve guide shows how to price them one by one. Once an AI agent answers first, the average blends two prices. Keep cost per human contact and cost per AI resolution as separate lines and show the blend underneath.
First contact resolution belongs beside this one too. A $6.25 contact that comes back twice costs $18.75, and only FCR shows it.
Agent attrition: the people line
Seven numbers describe the queue. This one describes who is staffing it.
Formula: agents who left in the period ÷ average headcount over the period × 100.
Deloitte's survey puts contact center attrition at 38% last year. MetricNet's benchmark of IT service desks shows analyst turnover of 43.1%. The made-up team loses 9 of its 25 agents in 12 months: 36%. Mind the period: one resignation in a month reads 4%, and a slide that multiplies it by 12 says 48%. Use a rolling twelve months.
Every other number on this page is produced by someone on a headset. At 38% a year, a 25-person team replaces nine or ten agents, and each replacement answers slower and solves less until they ramp. Tenure, coaching and scheduling are the levers.
The tile treats a top performer's exit and a poor fit's exit as the same event. Compare FCR for agents in their first quarter with FCR for veterans. A wide gap prices your attrition in resolution.
FCR by tenure is the number to put beside it.
AI resolution rate: the metric a hybrid queue needs
The denominator decides whether this number is honest.
Formula: AI conversations resolved ÷ all AI conversations started × 100. Count every conversation the AI touched, including the ones it handed off.
"Resolved" needs a written rule. CoSupport AI Agent counts a conversation as resolved when the customer doesn't reply within 72 hours after the AI's answer, hands the rest to people in the same helpdesk, and bills $0.50 per resolved conversation and nothing for escalated ones. The first 1,000 AI responses are free, which is enough to baseline this metric on your own queue. At Cocoatech, a software company with a two-person support team, AI resolves 81% of monthly chats.
This rate sets the volume the humans see, so it drives staffing, handle time and cost together.
Alone, it hides scope and silence. A rate computed over password resets reads high; one computed over billing disputes reads low. Compare it with the mix of what customers ask. And a silence rule counts a customer who gave up the same as a customer who got help, so open a sample of resolved conversations every month and read them. Decision logs in CoSupport 2.0 keep the AI's decisions and the data behind each one for exactly that check.
The pair for this one is CSAT measured on AI-handled conversations only. A high resolution rate with a low AI CSAT means the silence rule is counting the wrong thing.
How to improve call center metrics without breaking the others
Every lever moves two tiles. Run the roster hotter and cost per contact drops, speed of answer slows, abandonment follows, and attrition tends to come after. Push FCR up and handle time rises first, because solving takes time. Add an AI agent and AI resolution rate and cost improve while human AHT climbs and CSAT depends on the handoff.
So pull one lever a month and name the tile you expect to suffer:
- Fix the top repeat reasons. Pull the ten most common reasons for a second contact and fix the cause: a policy, a page, a broken flow. Lifts FCR and lowers cost per issue. Nothing suffers.
- Staff to the interval. Forecast by 30-minute block and schedule to it. Lifts speed of answer and cuts abandonment. Watch occupancy in the staffing model.
- Split channels. Phone, chat and email get their own thresholds. Every speed metric becomes readable. Headcount can rise if each channel gets its own team.
- Give agents the context. History and a drafted reply in front of the agent. Lowers AHT and lifts FCR. Watch CSAT if drafts read as generic.
- Let AI take the repetitive share. Order status, password resets and how-to questions go to an AI agent first, and on the phone line to an AI voice agent. Lifts AI resolution rate and lowers cost per issue. Watch escalation rate and CSAT on AI-handled contacts.
When two tiles collide, FCR and CSAT outrank speed and cost, because speed and cost describe the budget and the other two describe the product. If you can show the CFO only one number, show cost per issue. It holds the cost, the repeat contacts and the handle time in a single division: $8.00 in the made-up month.
Fix the denominators before you trust a tile
Write one definition per metric: the window, the exclusions, the channel. Keep it next to the tile.
Restate history when a definition changes, and say so on the dashboard. A quiet change to the FCR window shows an improvement that never happened.
Compare like with like. SQM's FCR figures come from post-call surveys at North American call centers. MetricNet's figures come from internal IT service desks. Deloitte's cost figure covers large B2C companies. Each is a reference from its own world, so name the world when you quote it to finance. Contact center metrics travel badly between industries, and worse between channels.
In a hybrid queue, count a handoff as one issue. A conversation that starts with the AI and ends with a person is one issue and one resolution, and the handoff deserves its own review in the AI-to-human handoff guide. For AI resolution ranges by industry, see the resolution rate benchmarks.