.png&w=96&q=75)

A good AI resolution rate in 2026 is not one fixed number. From what I see in this piece, most teams land around 40% to 80%, and the right target depends on ticket type, risk level, and how often the same issue repeats.
If I had to boil the article down to the main point, it would be this: I should not judge AI support by closure rate alone. I need to look at resolution rate next to answer accuracy, CSAT, handoff quality, and cost per resolved ticket. That matters even more in support teams that deal with software issues, finance rules, travel disruptions, or mixed ticket queues.
Here’s the short version:
- Retail often scores higher on repeat questions, but shipping and delay issues should be tracked on their own.
- Software usually lands lower because support depends on deeper product context and stronger retrieval.
- Finance needs auditable answers, not just closed cases.
- Travel should be judged by how well AI holds up during disruption spikes.
- Subscriptions can post high rates because many requests are simple account tasks.
- Across all industries, only eligible tickets should be used as the denominator.
- A ticket that gets reopened should count as failed, not resolved.
- For SaaS and ecommerce, CoSupport AI says it can resolve up to 90% of routine tickets when the knowledge base is complete.
One more point stands out: on complex QA tasks, the results in the article range from 45.3% to 76%. So if I see a high closure number without quality checks, I should treat it with caution.
Quick Comparison
| Industry | What “good” looks like | Main limit |
|---|---|---|
| Retail | High rates on product, returns, and policy questions | Shipping and logistics issues distort the number |
| Software | About 45% to 76% on complex tickets | Missing context and weak retrieval |
| Finance | Auditable answers plus fast handoff on restricted cases by integrating AI with human agents | Compliance and review rules |
| Travel | Strong performance during surge periods | Disruptions, route risk, policy shifts |
| Subscriptions | High rates on billing, plan, and account requests | Routing simple vs. hard cases correctly |
Bottom line: I’d use this article as a benchmark guide, not a scoreboard. The best number is the one that fits my ticket mix and still holds up on quality and cost.
sbb-itb-97114f1
Introduction
In 2026, the main question is pretty simple: what resolution rate is actually good?
A high number doesn't mean much on its own. It only matters if the AI gives the right answer, solves the issue, and keeps support costs under control. So resolution rate needs to be judged next to answer accuracy, answer-finding quality, and cost per resolved ticket - not ticket volume alone.
This is where things get messy. Raw resolution numbers can point you in the wrong direction, especially with complex cases. When an AI has to search through large knowledge bases, performance can drop fast. On complex knowledge tasks, results can range from 45.3% to 76%.
Before comparing industries, we need to pin down what this metric means. First, we define the AI resolution rate in 2026. Then we show what good looks like by industry.
What AI Resolution Rate Means in 2026
AI resolution rate is the share of support contacts that AI solves from start to finish, with no human reply.
Before looking at industry numbers, it helps to lock in one definition. A lot of support metrics sound close, but they measure different things.
| Metric | What it actually measures |
|---|---|
| AI resolution rate | Support contacts fully resolved by AI without a human reply |
| Ticket deflection rate | Users who find answers in self-service before creating a ticket |
| First contact resolution (FCR) | Issues solved in the first interaction, whether by AI or human |
| AI handoff rate | How often the AI transfers a conversation to a human agent |
Here’s the key point: deflection is not the same as resolution. Deflection tells you whether self-service worked before a ticket was created. AI resolution rate tells you whether AI handled the live support contact all the way through.
FCR can be tricky too. A team can post a strong FCR and still have a lower autonomous resolution rate if human agents are the ones closing most first-contact issues.
Many teams start around 40% to 60% autonomous resolution on eligible tickets.
When you measure it, use eligible contacts only as the denominator. That’s the baseline for the industry benchmarks below.
Why AI Resolution Rate Benchmarks Matter by Industry
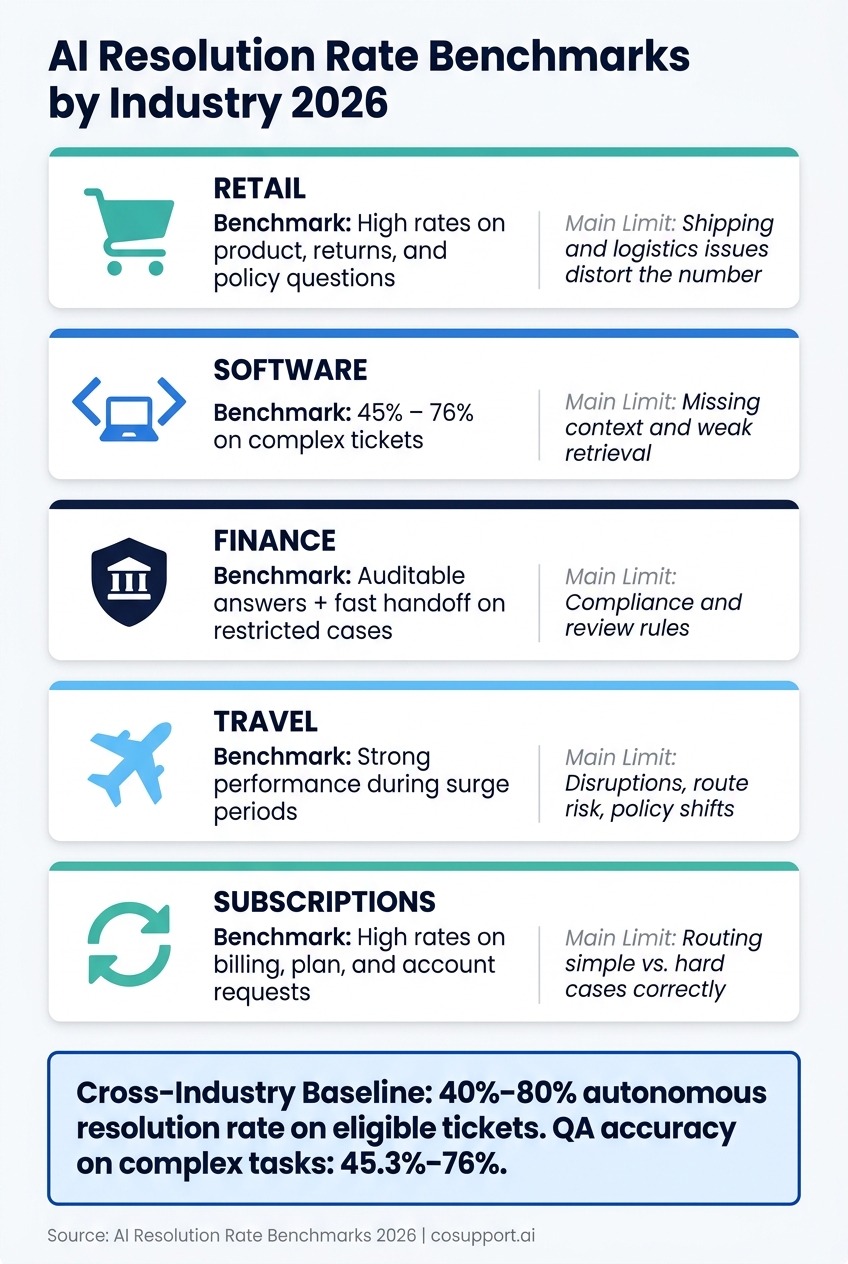
AI Resolution Rate Benchmarks by Industry 2026
Industry sets the bar for AI resolution rate. A benchmark only makes sense when it matches the kind of work coming in, the level of risk, and the mix of tickets a team handles. That’s why each industry needs to be judged against its own ticket mix.
The biggest driver is ticket type. Retail often scores higher because many retail tickets are repeatable and easier to solve. Think order status checks, return questions, or shipping updates. Software is different. Technical tickets usually need more context, back-and-forth, and deeper troubleshooting, so autonomous resolution tends to stay lower.
Finance comes with another layer: compliance. Some cases can’t be closed without human review, even when the answer seems clear. When compliance rules block certain actions, that human step is part of the job. So finance needs a benchmark built for that reality.
Travel has its own pattern too. Demand can swing in real time, and volume may spike fast during delays, cancellations, or other disruptions. In that kind of setting, a benchmark should reflect volatility, not just what happens during calm periods.
We measure these benchmarks against a small set of core metrics: cost per ticket, reply speed, accuracy, handoff rate, and CSAT. Next, we break down what good looks like in retail, software, finance, travel, and subscriptions.
1. High-volume retail
Retail is where the split shows up most clearly: some tickets sit squarely within AI’s control, while others depend on factors outside it. That’s why there isn’t one single retail benchmark. The mix of ticket types changes the number.
We found that retail tickets tend to fall into two buckets. One includes issues AI can handle well, such as product questions and return policies. The other includes issues shaped by outside conditions, such as order status and shipping delays. WISMO and other logistics-driven tickets should sit in their own tracking bucket, separate from support volume that AI can directly influence.
That split matters. If you lump everything together, the benchmark gets muddy. Separate tracking for each ticket type gives a much cleaner read on performance.
High resolution rates can still mislead if answers rest on guesses instead of sourced evidence. A bot may sound confident and still be wrong. The fix is simple: tag answers as extracted or inferred so the benchmark stays clean.
What good looks like in retail: strong resolution on product, returns, and other controllable tickets, with separate tracking for shipping-delay and order-status issues. That gives us a cleaner retail benchmark before we compare more complex categories.
2. Knowledge-heavy software
Retail support tends to be repeatable. Software support usually isn't.
That’s because software issues depend on deeper context across linked systems. A single ticket can hinge on docs, code paths, SQL schemas, config history, and infrastructure details. In this kind of support, you don’t just answer the question. You have to understand the logic behind the issue.
As ticket depth goes up, autonomous resolution tends to drop fast. The reason is simple: software support is less repeatable than retail, so shallow pattern matching stops working much sooner.
On LOCOMO (n=300), top systems reach 45.3% to 49.7% QA accuracy. On LongMemEval-S, leading systems reach 76%. In software support, QA accuracy is a strong proxy for autonomous resolution because bad retrieval often means the system has to hand the ticket off.
Simple vector indexes have a hard time with highly connected hub concepts. These are the central reference points that much of a project’s logic runs through. If retrieval misses those hubs, the answer often falls apart.
Graph-based systems do better because they connect the dots across code, docs, SQL schemas, and infrastructure. On LOCOMO, they reach a recall@10 of 0.497, compared with 0.048 for memory-based alternatives. That’s the big takeaway: retrieval structure matters as much as model quality.
This is what good looks like for knowledge-heavy tickets in 2026.
| Benchmark | Metric | Graph-Based (Top Tier) | Memory-Based (Baseline) |
|---|---|---|---|
| LOCOMO (n=300) | QA Accuracy | 45.3% – 49.7% | 27.3% |
| LongMemEval-S (n=50) | QA Accuracy | 76% | Tied with dense RAG |
| LOCOMO (n=300) | recall@10 | 0.497 | 0.048 – 0.149 |
For software support, 45% to 76% is a realistic benchmark range for autonomous resolution, depending on ticket complexity. It helps to tag answers as Extracted or Inferred so teams can see when the model is pulling straight from source material versus filling in missing pieces.
The gap gets even larger once compliance or approval steps enter the workflow.
3. Regulated financial support
When software support fails, it usually fails because context is missing. In finance, the bigger problem is different: if auditability is missing, the whole answer can fall apart.
That’s why resolution rate, by itself, isn’t enough in regulated financial support. An answer only counts if someone can audit it.
This is where audit tags come in. Use EXTRACTED when the answer is backed by the source. Use INFERRED only when the model has to reason past what the source text directly says.
Use this split:
| Case Type | AI handles | Handoff required |
|---|---|---|
| Policy lookups & rate checks | ✓ | - |
| Identity verification | ✓ | - |
| Sanctions & asset freeze queries | - | ✓ |
| Regulatory disputes (inferred data) | - | ✓ |
For regulated financial support, the benchmark is auditable answers and immediate handoff on ambiguous or restricted cases.
Travel changes the pattern again, because disruption spikes reshape ticket mix fast.
4. Disruption-prone travel
Resolution Sustainability: The Metric That Actually Matters Here
Travel works on a different clock. One disruption can reshape the support queue in minutes, not days. Support doesn't usually break down through a slow slide. It breaks when the volume spikes all at once.
A weather event or system outage can send ticket volume soaring overnight. And a resolution rate that looks fine under normal conditions can crack under pressure, especially if the system lacks hallucination-free solutions.
That’s why the main benchmark in travel is resolution sustainability: can AI keep resolving tickets when demand surges?
Systems that handle long-context tasks, like disruption rebooking, reach about 76% QA accuracy. Broader complex retrieval tasks land closer to 45.3%. That gap matters a lot when things go sideways.
A clear example came with the July 2026 Strait of Hormuz closure, which pushed war-risk insurance to 8 times pre-crisis rates. In a moment like that, the line between a routine change and a risky case gets very thin, very fast.
So the benchmark is simple: keep routine changes automated, and move risky cases to a human fast.
| Request Type | AI handles | Handoff required |
|---|---|---|
| Status checks and standard itinerary updates | ✓ | - |
| Basic rebookings on approved routes | ✓ | - |
| Disruptions involving unapproved routes or war-risk zones | - | ✓ |
| Safety protocol questions during rapid geopolitical escalation | - | ✓ |
Good travel support keeps the easy, repeatable work with AI and routes anything tied to risk, policy, or route exceptions to a person.
Use EXTRACTED and INFERRED tags to flag unapproved routes and safety-sensitive cases for human review before AI takes action.
5. Low-friction digital subscriptions
The Benchmark Is High Because Requests Are Simple
After travel, subscriptions are the steady case. Most requests are routine, low-risk, and lead to pretty predictable outcomes.
That’s why digital subscription support should be judged on simple account work, not just total volume. This is one of the clearest places for AI to do well in this article: billing date lookups, plan changes, and password resets are repeatable, low-risk tasks that fit the job well.
The better benchmark, from what we found, is to track resolution by request type. In practice, that makes billing lookups, plan checks, and similar account tasks the main benchmarks. Each answer should be tagged as Extracted or Inferred so the data stays clean and auditable.
It also helps to track the cost per ticket. Simple subscription questions should cost less than complex cases. If costs stay flat across both simple and complex tickets, that usually means routing is off.
6. Cross-industry baseline
One Number That Cuts Across Every Sector
Once you get past sector-by-sector benchmarks, the cross-industry gut check is pretty simple: resolution rate has to sit next to answer quality. Across retail, SaaS, finance, travel, and subscriptions, resolution rate on its own doesn’t tell the whole story. QA accuracy shows whether the answer was right, not just whether the ticket was marked closed.
In 2026, AI QA accuracy on complex query-answering benchmarks ranged from 45.3% to 76%. That spread is a big warning sign. A closed case can still contain a bad answer, which means closure rate by itself can point you in the wrong direction. That’s why every closed ticket should carry a confidence label.
Track each closure with a confidence tag: Extracted for direct source answers, Inferred for reasoned ones. A high share of Extracted resolutions says more than a growing share of Inferred closures. If Inferred results start climbing, audit those answers before treating the benchmark as healthy.
What Most People Get Wrong About Resolution Rates
These benchmarks only mean something if the metric itself is clean.
The Denominator Problem Nobody Talks About
The biggest mistake? Comparing resolution rates without checking the denominator.
All-ticket rates look at total incoming volume. Eligible-ticket rates look only at the tickets the AI was built to handle. Both matter. But they answer different questions.
When people mix them, every benchmark above gets warped.
Closed ≠ Resolved
Closed does not mean resolved.
If a case gets reopened, it should count as a failed resolution. And if the AI gives an uncertain answer, don’t mark it as resolved until it makes it through the no-reopen window.
That’s why raw resolution rate can point you in the wrong direction.
A lower resolution rate can still be the better result if CSAT, cost per resolved ticket, and human workload all improve. A failed AI attempt followed by human handling can cost up to 114 times more than the initial AI attempt. That’s a huge gap.
So instead of forcing shaky cases through automation, use confidence tags to send uncertain work to humans. The same EXTRACTED and INFERRED framework from the sections above fits here too.
Here’s a quick way to tell whether the metric is set up well:
| Signal | Misleading Setup | Healthier Setup |
|---|---|---|
| Denominator | All tickets | Eligible tickets only |
| Reopened cases | Counted as closed | Counted as failed resolutions |
| Handoff quality | Hidden in transfer stats | Tracked by confidence tags |
| Human workload | Not measured against capacity | Measured against available human hours |
| CSAT and cost | Separated from the metric | Tracked alongside resolution rate |
The Metrics That Should Sit Next to Resolution Rate
Resolution rate only shows part of the picture.
You get a much better read when you track it next to cost per resolved ticket, CSAT, and human workload. Pay close attention to workload depth: human minutes used versus human hours available.
If that ratio keeps climbing while the resolution rate still looks healthy, the AI is probably struggling with high-complexity transfers.
Once the metric is clean, we can compare how CoSupport AI for Zoho fits these benchmarks.
How CoSupport AI Fits 2026 Benchmarks
With the metric in place, we looked at whether CoSupport AI falls within the benchmark ranges covered above. Then we matched those ranges against CoSupport AI’s setup and the kinds of tickets it handles.
CoSupport AI connects natively to Zendesk and Freshdesk, learns from your help center, past tickets, FAQs, and internal docs, and can go live in under 10 minutes.
For SaaS and ecommerce teams with complete knowledge bases, CoSupport AI can resolve up to 90% of routine tickets on its own. That lines up best with the repeatable-ticket ranges we covered earlier.
If a ticket needs human help, CoSupport AI sends it to an agent automatically.
You can check the CoSupport AI case studies and product page for setup details.
Key Takeaways
Across the industries covered, AI resolution rates in 2026 tend to land between 40% and 80%. Where a team ends up in that range usually comes down to one thing: ticket repeatability.
Support teams that deal with dense product docs, policy details, or layered troubleshooting still need better retrieval to push accuracy higher. In many cases, that means tools like knowledge graphs, not just basic search over help center content.
That’s why resolution rate, by itself, doesn’t tell the whole story. A high number can look good on paper and still hide poor customer outcomes or messy escalations.
The better way to judge AI support is to track resolution rate alongside CSAT, handoff quality, and cost per ticket.
Those four metrics are the benchmark, not resolution rate alone.
| What to track | Why it matters |
|---|---|
| Resolution rate | Shows how much AI handles on its own |
| CSAT | Confirms quality, not just volume |
| Handoff quality | Measures how cleanly AI passes hard tickets to humans |
| Cost per ticket | Keeps the economics honest |
The FAQs below answer the measurement questions teams usually ask next.
See Where We Stand Against 2026 Benchmarks
Those benchmark ranges only mean something when we compare them to our own ticket mix. And the fastest way to do that is with our own support data.
CoSupport AI uses our tickets, help center content, and macros to answer based on our own knowledge base. That means the output stays tied to our actual support data, not some generic setup.
The 14-day free trial shows how our ticket mix stacks up against these benchmarks. Pricing starts at $0.19 per resolved ticket.
Try CoSupport AI free for 14 days - no code required.
.png)